
Monitors
A monitor is a check cterm runs on a schedule, every few minutes or at set times, with every tab closed: a shell script in the project folder, a question a model answers, or both. You say what matters, such as a disk at 85% or more, and cterm tells your phone when that starts to hold and once when it clears, never on every run in between. Each monitor's state, last value and history live in the project page's Monitors tab.
What it is for
Some things only need a look now and then, and are easy to forget: is a server's disk filling up, did last night's backup run, does the site still answer, is there an error in the log. A monitor looks for you:
- It runs by itself, on its schedule, as long as cterm runs on this Mac.
- It tells you once. A push when the condition starts to hold, one more when it clears; a check that keeps failing tells you once that it is failing.
- A model can judge what a number cannot. Ask "at the rate it grows, will this disk be full within a week?" on the script's output and get yes or no with a short value.
- It keeps its history, so you can see how the value moved and when it alerted.
How to use it
Make a monitor
In the project page's Monitors tab, click New monitor (on an empty tab, an admin also gets Start from the example: a server's disk over ssh). Give it a Name, then pick what It runs:
- A script: a shell command run with
sh -cin the project folder, as you, with your ssh keys. Its output is the result. Only an admin writes or changes one. - A question to a model: the model answers yes or no with a short value. Pick its Model: Haiku, Sonnet or Opus.
- A script, then a question to a model on its output: the model reads what the script printed.
Then Alert when:
- A number past a threshold: the first number of the result (the script's output, or the model's value), at
or above, above, below, at or below, equal to or not equal to the number you give.
87%reads as 87. - A word found, or not: for example
ERRORfound in a log, or today's date not found in a backup listing. - The script exits with an error: any exit code but 0. A script that cannot run at all (a command not found) and ssh that cannot connect count as a failed check instead, not as the condition.
- The model says yes.
How often: every 5 minutes up to every 24 hours, or a routine's times (every day, weekdays, days of the week, or every few hours from a time until midnight, in a time zone). Failing after says how many checks in a row that cannot run (a script that fails, a host not reached, a model that gives no answer) make the monitor say it is failing. Muted keeps it running and keeping its history, and tells nobody.
Make the monitor saves it, and it runs at once so the tab shows where it stands.
Read the tab
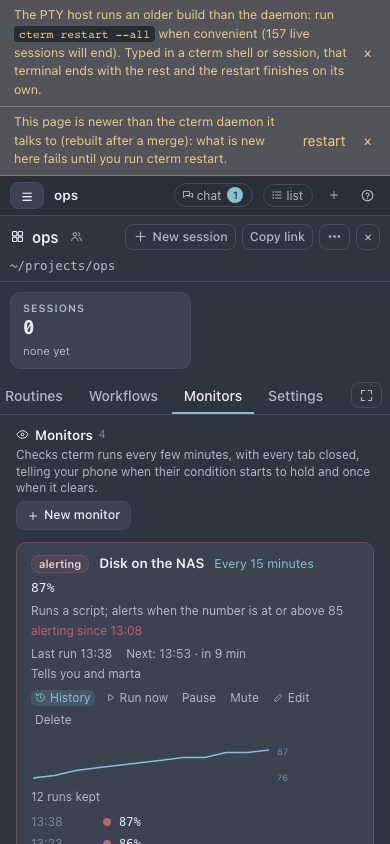
The monitors are listed with what needs a look first: alerting, then failing, then the rest, then the paused ones. Each row shows its state (alerting, failing, ok, not run yet, paused), its last value, how often it runs and when it alerts in words, since when it has been alerting, its last and next run, and who it tells.
History opens its runs, newest first: the time, the value, and a line where something changed ("started alerting", "back to normal", "began failing", "runs again"); a line of its numbers when it reads a number; and what the model's calls cost at list price. cterm keeps a monitor's last 500 runs.
The buttons
- Run now runs the check at once; its schedule stays as it is.
- Pause stops it until Resume, which runs it once and then on its schedule.
- Mute keeps it running and silent; Unmute brings the notifications back.
- Edit changes it. A new check or condition starts its state afresh and runs it at once.
- Delete removes it with its history, after asking.
- Tell me too, for someone the project is shared with, sends them the same notifications as the owner.
Where it tells you
When a run starts an alert, clears it, begins failing or runs again after failing, cterm sends a push to the devices where you turned on push notifications (the bell in the sidebar), titled with the monitor's name and what happened, "Disk on the NAS: alerting", with the value as its text. Tapping it opens the project page on that monitor. A page of cterm you have open shows the same as a line at the bottom, and as a browser notification when its bell is on.
monitors-shot.mjsHow it works
Monitors are cterm's own, kept in its store (~/.cterm/cterm.db, monitors.ts), not files of the project: a
script runs as this Mac's user with its ssh keys and no sandbox, so only an admin writes one, and cterm remembers who
wrote it and refuses to run it once that account is no longer an admin. A script runs in the project folder with the
project's environment for at most five minutes, with CTERM_MONITOR (its name) in its environment.
A question goes to the model as one claude -p call on the project's Claude login, the way the session briefs do:
there is no API key, and the call counts against your plan's usage like any session. It is given the question and
the last 16,000 characters of the script's output, and answers yes or no, a short value and one sentence of why. One
Haiku call took 3 seconds and cost $0.0004 at list price; a monitor asking Haiku every 15 minutes makes 96 calls a
day, about four cents at list price. Sonnet costs two to three times as much per call, Opus about five times.
The daemon looks at the clock at least once a minute, runs what is due (three checks at a time, one run of a monitor at a time) and counts the next run from when this one was due. A run missed while the Mac slept or cterm was off runs once when it is back, never once per missed time. Each monitor remembers whether its condition held at the last run that ran, since when, and how many checks in a row failed, which is how it tells you once per episode.
The owner of the project makes and changes its monitors, which run as the owner. Anyone who sees the project sees them and their history; the owner or an admin may run one now, pause, mute or delete it.
Scenarios
A server's disk over ssh
A monitor "Disk on the NAS" runs every 15 minutes:
ssh -o BatchMode=yes -o ConnectTimeout=10 nas df -P / | awk 'NR==2 {print $5}'It alerts when the number is at or above 85. The day the disk reaches 87%, your phone says "Disk on the NAS:
alerting, 87%". It stays quiet while the disk stays above 85%, and says "back to normal" once you have cleaned up. If
the server stops answering, ssh exits with 255 and the monitor says it is failing after three runs in a row, rather
than that the disk is full. BatchMode=yes makes ssh fail at once instead of asking for a password nobody can type.
Will it fill up this week?
A number does not say how fast the disk grows. A second monitor runs once a day at 08:00 with a script, then a question on its output:
ssh -o BatchMode=yes nas 'df -P / && du -sh /var/lib/docker /var/log'"At the rate the disk grows, will it be full within seven days?", answered by the model, alerting when the model says yes. Its value says something like "about 12 days left", and its reason which line made it answer so. On Haiku that is about $0.0004 a day at list price.
A site that stops answering
curl -fsS -o /dev/null --max-time 20 https://example.com every 5 minutes, alerting when the script exits with
an error: curl exits with an error when the page does not answer or answers with an error.
Related
- The project page: its tabs, the Now strip and routines.
- Workflows: steps run by cterm, with a script step and a notification of their own.
- The master view: the Monitors panel shows every project's monitors on a second screen.
- cterm on a phone: turning on push notifications.